
Fig. 3.
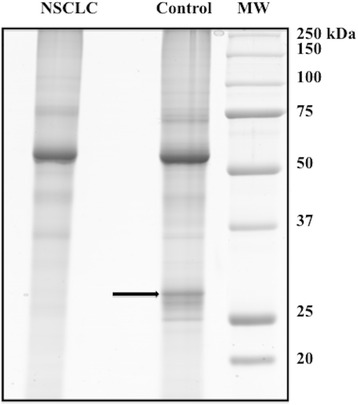
Differential protein expression profile between pooled tumour and control samples from 8 NSCLS patients (6 with histotype of AC and 2 with histotype of ASC). Arrow indicates protein band associated to CAI and CAII isoforms identification. For other details see materials and methods