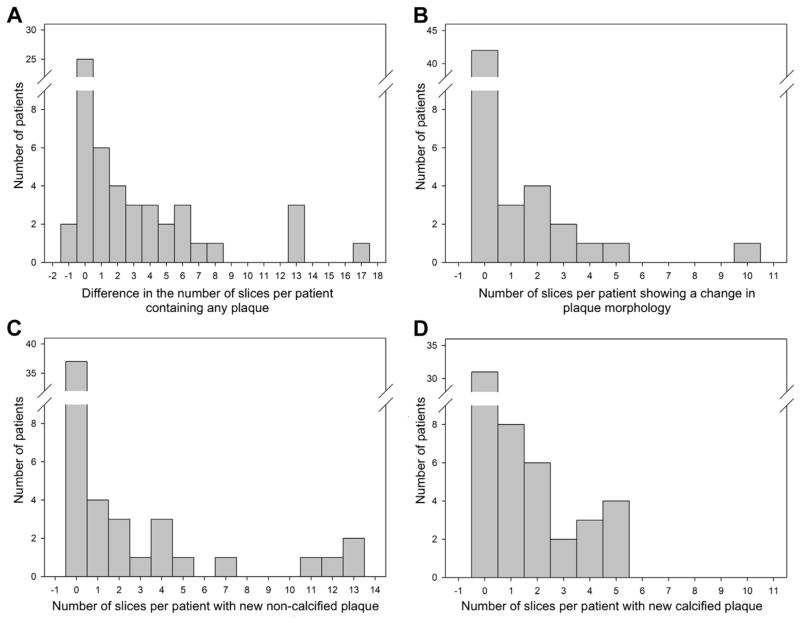
Fig. 2.
Histogram analysis showing the change in the number of slices per patient from the baseline to the follow-up scan exhibiting specific plaque qualities. (A) Any detectable plaque, (B) change of plaque morphology, (C) new noncalcified plaque, and (D) new calcified plaque. Note that in most patients no change in any of the 4 categories was found.

