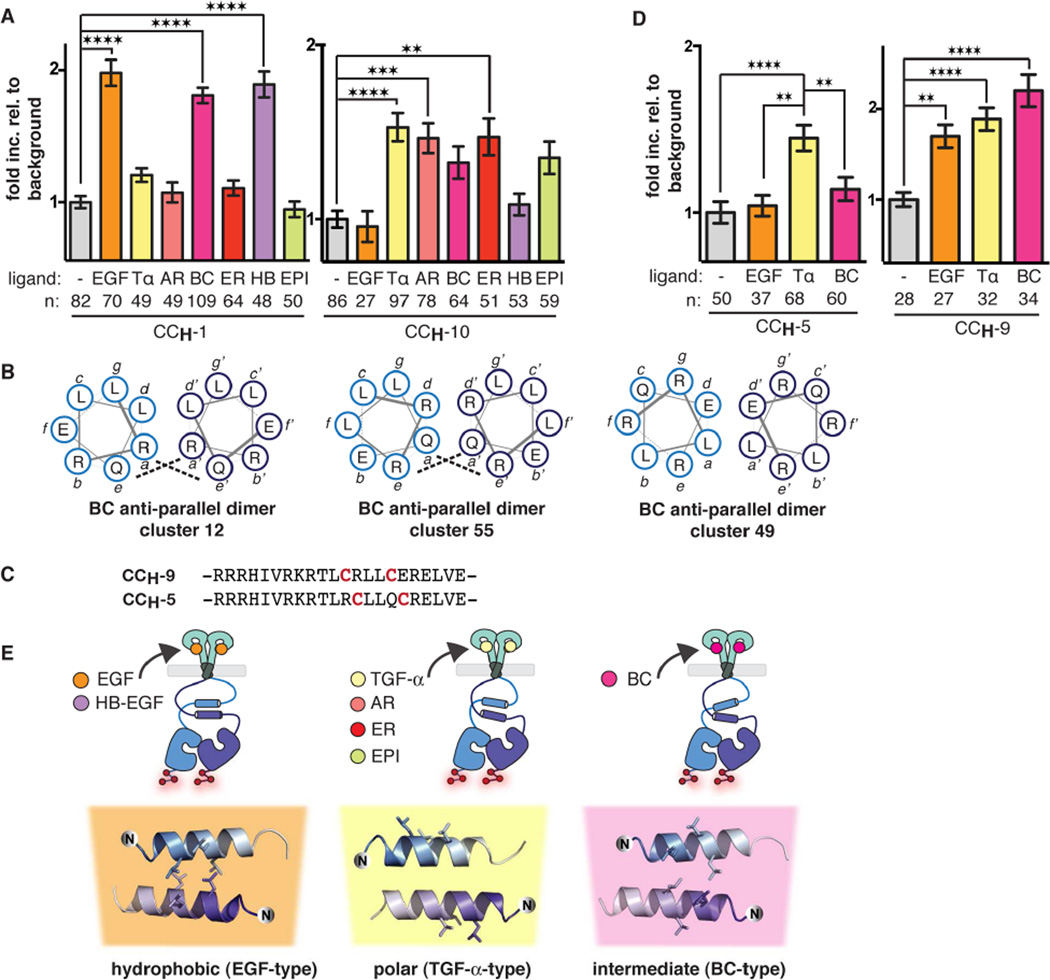
Figure 5.
JM-A conformation correlates with effects on downstream signaling.
(A) Quantified fold increase in expression-corrected ReAsH fluorescence over background of cells expressing CCH-1 or CCH-10 and treated with either EGF, TGF-α, BC, HB-EGF (1 ng/mL) or AR, ER, or EPI (2 µg/mL). For TIRF microscopy images and Western blots showing the activity of CCH-1 and CCH-10 upon stimulation with each growth factor, see also Figures S5A and S5B.
(B) Helical wheel diagrams illustrating the interfaces of three antiparallel structures potentially adopted in the BC-activated JM-A region of EGFR.
(C) CCH-5 and CCH-9 primary sequences.
(D) Quantified fold increase in expression-corrected ReAsH fluorescence over background of cells expressing CCH-5 or CCH-9 and treated with or without EGF, TGF-α, or BC (1 ng/mL). For helical wheel diagrams showing the relative orientation of Cys-Cys motifs in EGFR variants when assembled into the anti-parallel coiled coils defined by clusters 12, 55, and 49, see Figures S5C and S5D. For TIRF microscopy images and Western blots showing the activity of CCH-5 and CCH-9 upon stimulation with EGF, TGF-α, and BC, see Figures S5F and S5G.
(E) EGFR stimulates three ligand-stimulated JM-A conformations. Activation by EGF and HBEGF is best represented by cluster 5 structures with a hydrophobic interface while activation by TGF-α, AR, ER, and EPI are best represented by cluster 1 structures with a polar interface. BC-activated EGFR likely adopts an intermediary conformation represented by cluster 12. All structures show the side chains of L655, L658, and L659 explicitly. Error bars represent standard error. ** p < 0.01, *** p < 0.001, **** p < 0.0001 from one way ANOVA with Bonferroni post test (see also, Figure S5).

