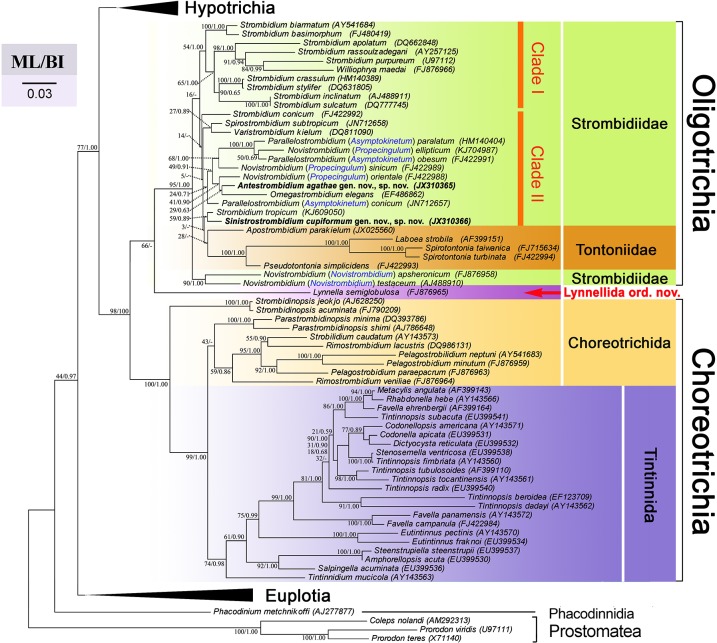
Fig 6. Maximum Likelihood tree inferred from SSrRNA gene sequences.
Numbers at the nodes are support values presented in the following order: Maximum Likelihood (ML) bootstrap values and Bayesian inference (BI) posterior probabilities. Nodes absent from BI tree are indicated by a hyphen. The scale bar indicates the number of substitutions per 10 nucleotides.

