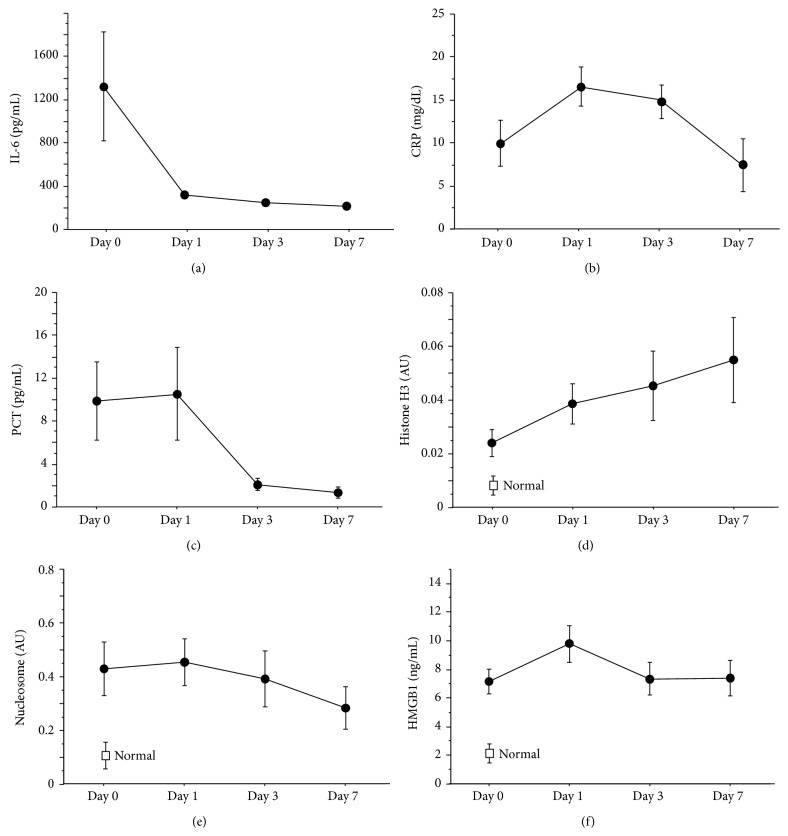
Figure 2.
Changes of biomarkers. The time-courses of various biomarkers are plotted in the figure ((a) IL-6, (b) CRP, (c) PCT, (d) histone H3, (e) nucleosome, and (f) HMGB1). The levels of histone H3, nucleosome, and HMGB1 in healthy donors (n = 5) were also shown in (d), (e), and (f). The levels of IL-6, CRP, and PCT peaked on Day 1 or Day 3 and decreased thereafter. In contrast, the level of histone H3 increased along with the days and reached its maximum level on Day 7. Data are expressed as means ± standard error. AU: absorbance units, IL-6: interleukin 6, CRP: c-reacting protein, PCT: procalcitonin, and HMGB1: high-mobility group protein Box 1.

