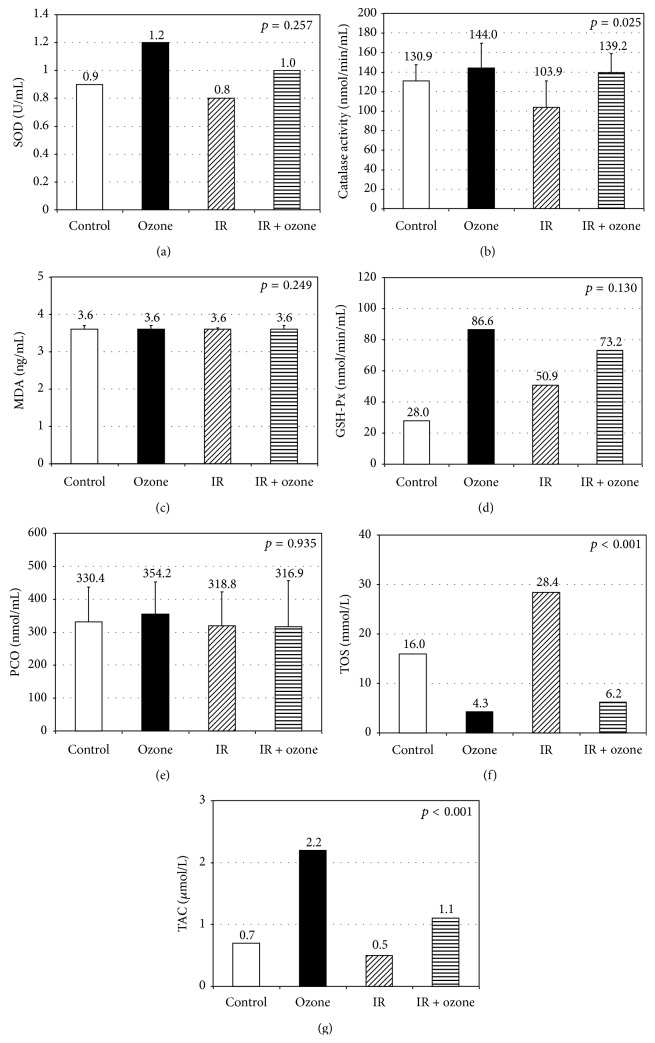
Figure 3.
Biochemical measurements regarding the study groups. The white and black bars represent control and Ozone groups, respectively. The hatched bars represent the situation after IR injury (diagonal lines). The hatched bars represent the situation after Ozone exposure (horizontal lines) prior to intestinal IR injury.

