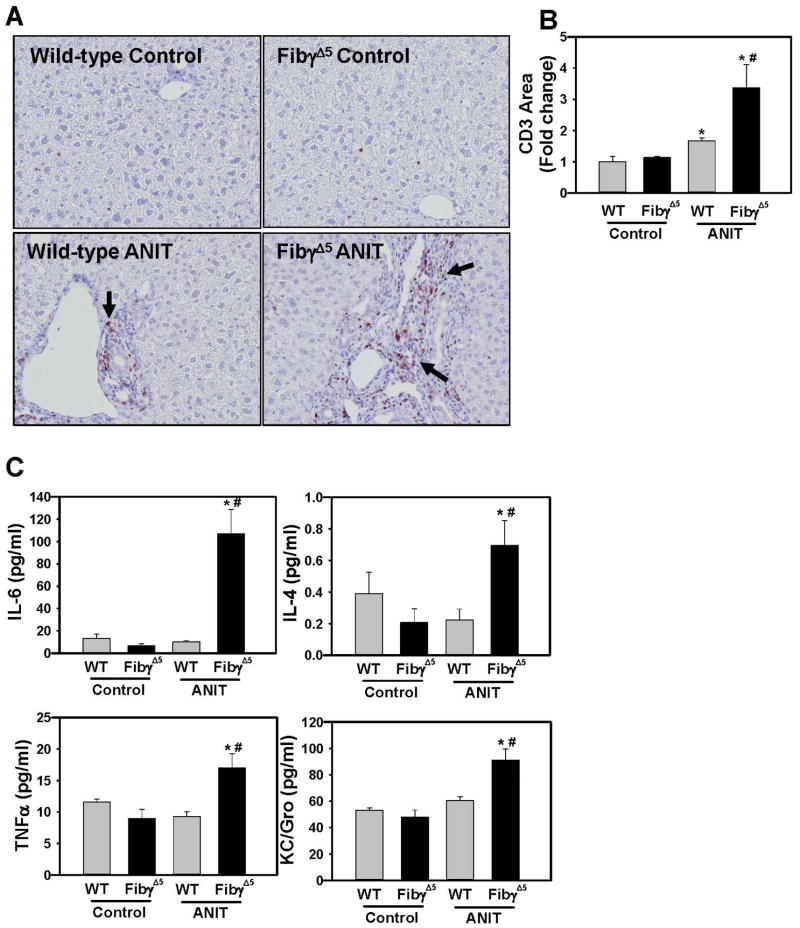
Figure 6. Increased hepatic inflammation in ANIT-treated FibγΔ5 mice.
Wild-type (WT) and FibγΔ5 mice were fed control diet (AIN-93M) or an identical diet containing 0.025% ANIT for 4 weeks. (A) Representative photomicrographs (200X) and (B) quantification of CD3 staining. (C) Serum levels of cytokines IL-6, IL-4, KC/Gro, and TNFα were determined as described in Materials and Methods. Data are expressed as mean ± SEM; n = 4 mice per group for control diet and 9–10 mice per group for mice fed ANIT diet. *p<0.05 vs. control diet within genotype and #p<0.05 vs. WT mice fed the same diet.

