
Fig. 1.
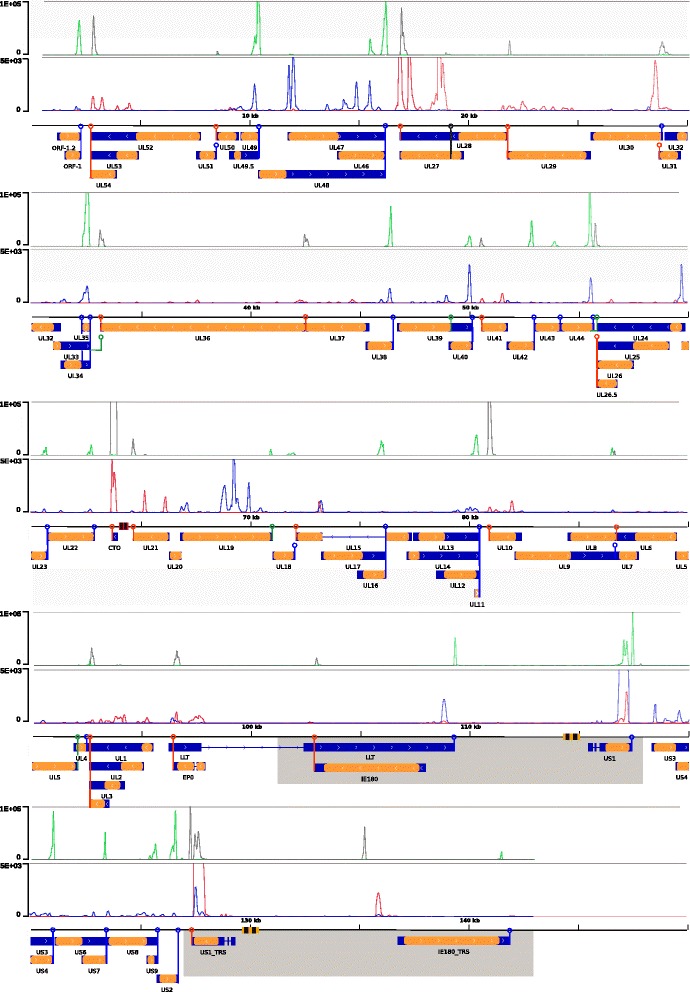
Transcriptional map of the PRV genome identified by total RNA sequencing and PA-Seq. Genetic map: orange: coding sequences, blue: transcripts, red striped rectangle: OriL palindrome, yellow striped rectangles: OriS palindromes, grey: internal and terminal repeat regions, blue circles: PA site on + strand, red circles: PA site on –strand, green circles: alternative PA site on + strand, black circles: alternative PA site on –strand. Expression levels (in coverage per base): upper box: PA-Seq expression, green: +strand read coverage, black: −strand read coverage, lower box: totalRNA sequencing, blue: +strand coverage, red: −strand coverage