
Fig. 3.
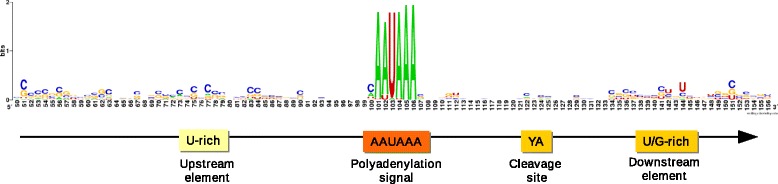
PA signal consensus of PRV and schematic organization of eukaryotic PA sites. The sequence logo represents nucleotide occurrence frequencies within the +/−50 bp region of PA signals in the viral genome. Colored boxes indicate the functional elements affecting eukaryotic polyadenylation