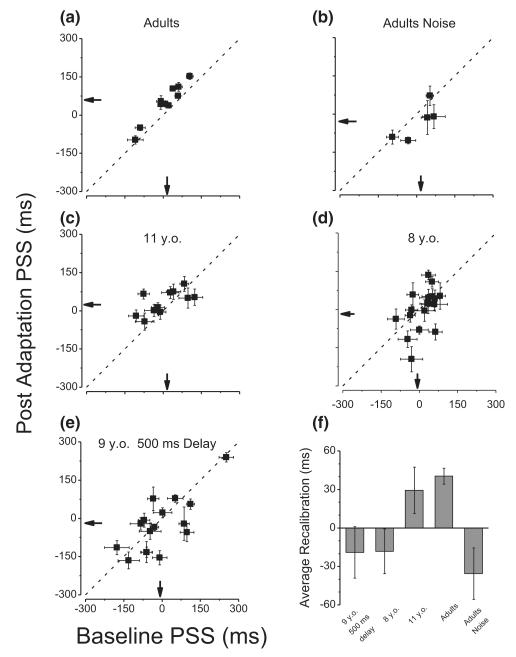
Figure 3.
Points of perceived simultaneity (PSS) after adaptation to delayed sensory feedback, plotted as a function of PSS in the baseline condition, for the various groups. (a) Adults: standard condition (adaptation at 200 ms delays). (b) Adults: adaptation to 200 ms delays, with auditory noise added to the stimulus (see Methods). (c) 11-year-old group (7.7 ± 0.1 years), standard adaption condition (200 ms adaptation); (d) 8-year-old group (11.3 ± 0.3 years), standard condition (200 ms adaptation); (e) Children group (9 ± 0.2 years) with 500 ms adaptation; (f) Bar graphs summarizing the average recalibration effects (difference in temporal order judgment task for the baseline and adaptation conditions), for the five different groups. Error bars show ±1 SEM.

