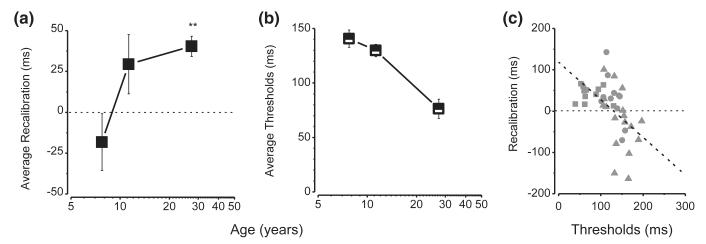
Figure 4.
Average recalibration effect for all groups measured as the differences in the PSS in the two experimental blocks as a function of age.
(a) Average thresholds (calculated from the individual standard deviations of each group) as a function of age.
(b) The recalibration effect as a function of thresholds, for individual subjects; squares represent adult subjects, circles 11-year-olds and triangles 8-year-olds. Recalibration magnitude correlates strongly with thresholds. The dashed line shows the linear regression (R2 = 0.25; p < .001, slope = −0.9).

