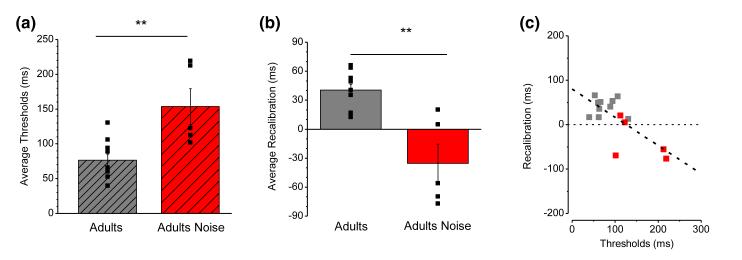
Figure 5.
(a) Average thresholds for the two adult groups in the standard condition (grey) and in the noise condition (red). Black symbols represent individual data. Thresholds are significantly higher in the noise condition (153 ms) compared with the standard condition (76 ms).
(b) Average recalibration for the two adult groups in the standard noise conditions (color-coded as a), with symbols showing individual data. The noise causes a reduction of 53 ms in the average calibration.
(c) The recalibration effect as a function of thresholds. The grey symbols show data for the standard condition and red symbols the data for the adult noise group. The dashed line shows that the effect of recalibration linearly decreases with the increasing of thresholds (R2= 0.25; p < .005).

