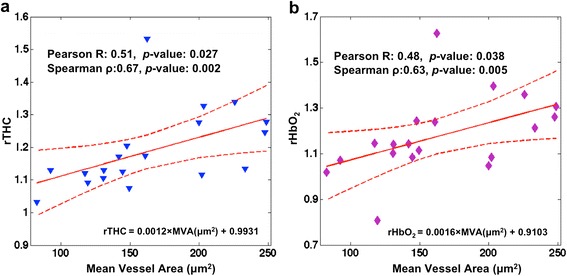
Fig. 5.

Correlation between a relative total hemoglobin concentration (rTHC) and b relative oxyhemoglobin concentration (rHbO2) versus mean vessel area (MVA, μm2) (n = 19). Dotted lines indicate the 95 % confidence interval of the mean of the linear fit. These pilot results suggest that diffuse optical tomography is measuring an increased blood supply in the larger-diameter blood vessels of these cancer tissues
