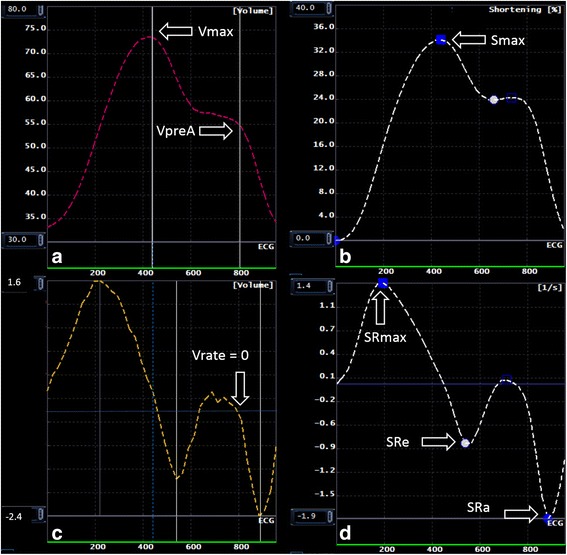
Fig. 2.

Multimodality Tissue Tracking, volume analysis (Panel a), volume rate analysis (Panel b), strain analysis (Panel c) and strain rate analysis (panel d). Green line: End-systole. White line: Point where volume-rate curve: 0; Corresponding VpreA in the volume curve
