
Figure 5.
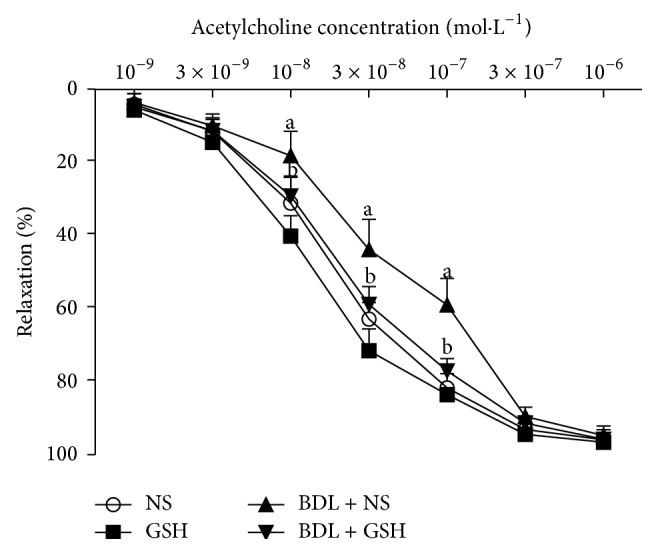
Response elicited by ACh in rat thoracic aortic rings from NS group, GSH group, BDL + NS group, and BDL + GSH group (n = 6). Data are presented as mean ± SD. a P < 0.01 versus NS group for % maximum response.
Official websites use .gov
A
.gov website belongs to an official
government organization in the United States.
Secure .gov websites use HTTPS
A lock (
) or https:// means you've safely
connected to the .gov website. Share sensitive
information only on official, secure websites.
Response elicited by ACh in rat thoracic aortic rings from NS group, GSH group, BDL + NS group, and BDL + GSH group (n = 6). Data are presented as mean ± SD. a P < 0.01 versus NS group for % maximum response.