
Fig. 7.
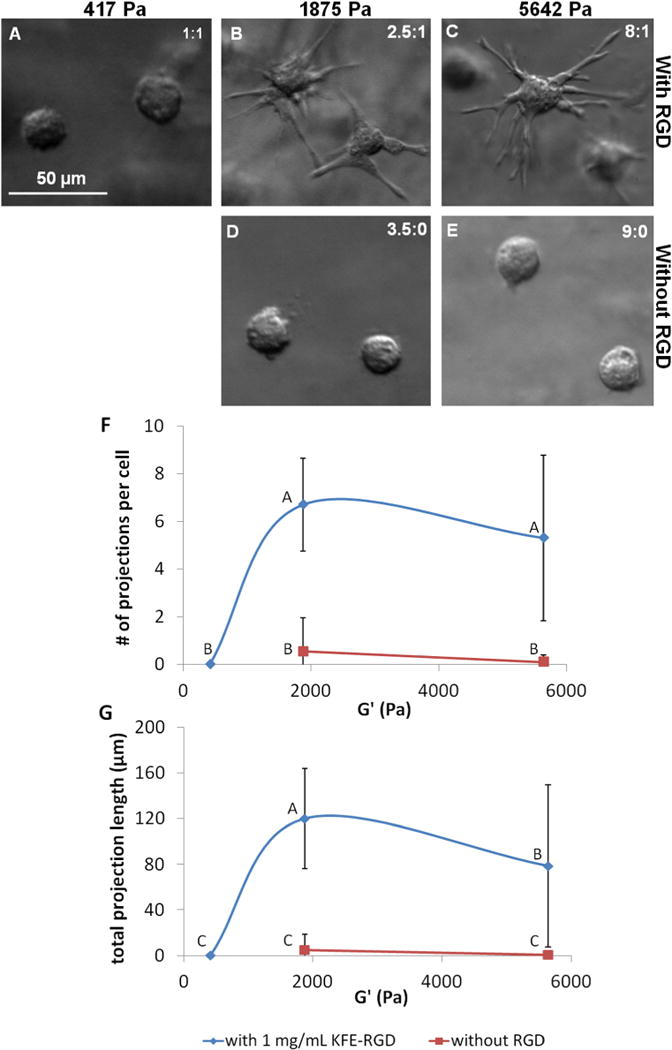
hMSC morphology is influenced by both stiffness and RGD concentration. (A–E) DIC images taken after 24 h of culture within SAP show that hMSC extend projections into their surroundings in gels of high stiffness in the presence of RGD, but remain spherical in the absence of RGD, regardless of stiffness. The stiffness values for images (A, B) were measured with rheology, while the stiffness values for (C–E) were estimated from Fig. 1B. Peptide concentrations are given in the top right corner of each image as mg ml−1 KFE: mg ml−1 KFE-RGD. (F, G) Quantification of the number of projections per cell and the total length of these projections per cell suggests that hMSC morphology is dependent on both stiffness and RGD concentration after 24 h. A total of 20 cells were randomly selected and measured from three replicate gels at each condition. Points not labeled with the same letter are statistically different. Error bars indicate standard deviations.