


Fig. 2.
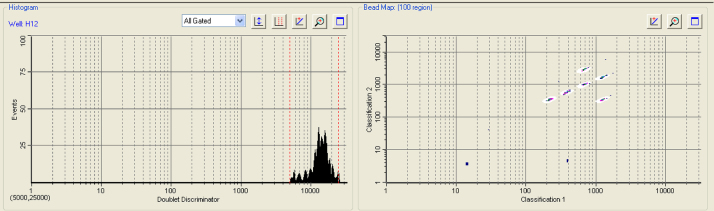
Bead map output from BioPlex Manager showing the classification of the individual beads coupled to the six different cytokines.
Official websites use .gov
A
.gov website belongs to an official
government organization in the United States.
Secure .gov websites use HTTPS
A lock (
) or https:// means you've safely
connected to the .gov website. Share sensitive
information only on official, secure websites.
Bead map output from BioPlex Manager showing the classification of the individual beads coupled to the six different cytokines.