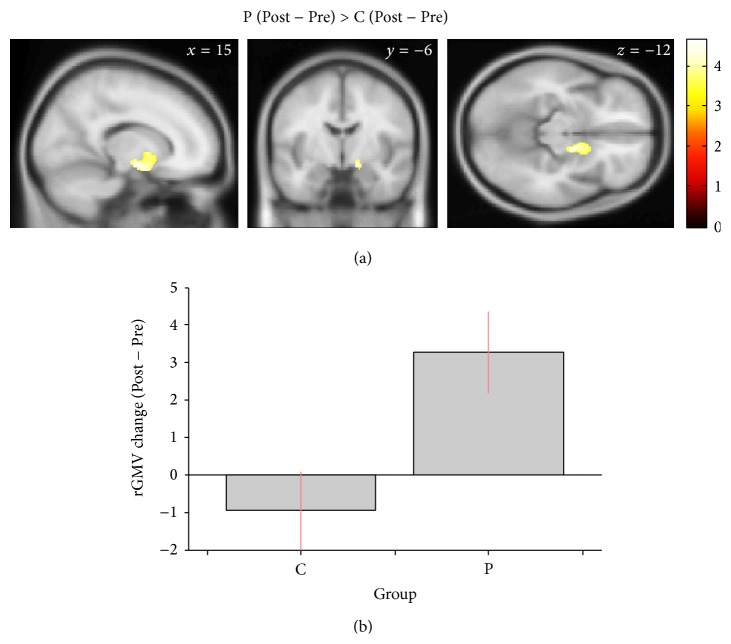
Figure 4.
Significant between-group difference in regional gray matter volume (rGMV) changes. (a) In the structures around the right caudate, the rGMV changes were significantly different between Groups P and C. The colored cluster shows the region that exhibited significant differences in rGMV change with family-wise error corrected P < 0.05 at the nonisotropic adjusted cluster level [59] with an underlying voxel level of P < 0.001. (b) The average of rGMV changes in each group shows that the differences in the region were largely because of the rGMV increases in Group P. The error bars in the graph show the 95% confidence intervals.

