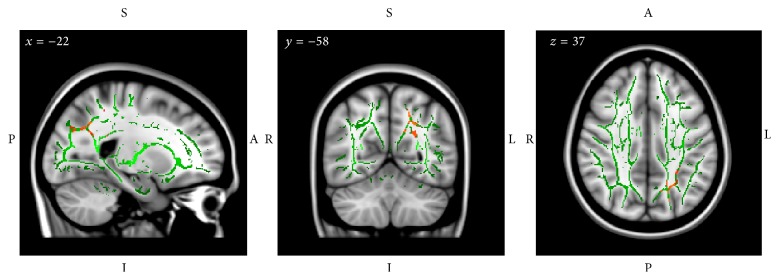
Figure 5.

Tract-based spatial statistical analysis in Group C detected significant increases (Post and Pre) in fractional anisotropy (FA) in the left posterior white matter. Gray: MNI152 T1 template image, green: intergroup average white matter skeleton, and red-yellow: voxels that show threshold-free cluster enhancement-corrected significant (P < 0.05) increases in FA in Group C. Note that the images are displayed according to radiological convention, with the right hemisphere on the left.
