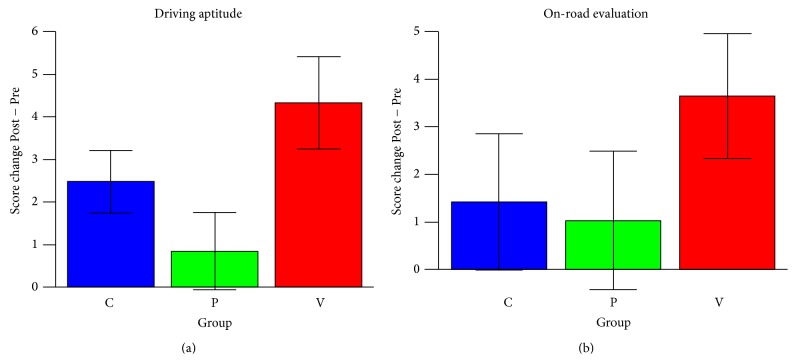
Figure 6.
Changes in driving safety measures in each training group. The measures are as follows: (a) the total grades obtained from the driving aptitude test unit and (b) the total grades obtained from the on-road driving safety test. The score changes were adjusted for age, sex, and Pre (baseline) scores. The error bars in the graphs show the standard errors of the mean (SEM) of the subjects in each group.

