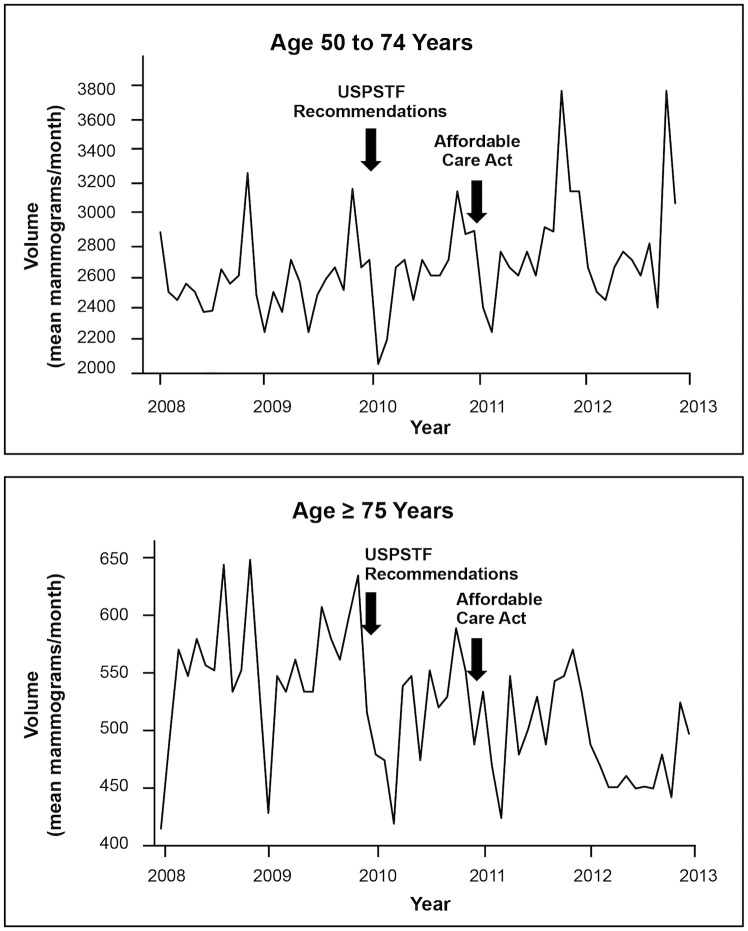
Fig 2. Screening Mammography Changes for Women 50–74 and ≥75.
The mean number of screening mammograms per month performed in the health system from 2008 through 2012. Arrows indicate the times of new screening recommendations and implementation of the Affordable Care Act. New recommendations were not associated with changes for women age 50–74, but were associated with decreased screening for ≥75, while the Affordable Care Act was associated with increased screening among women age 50–74 and no changes for ≥75.

