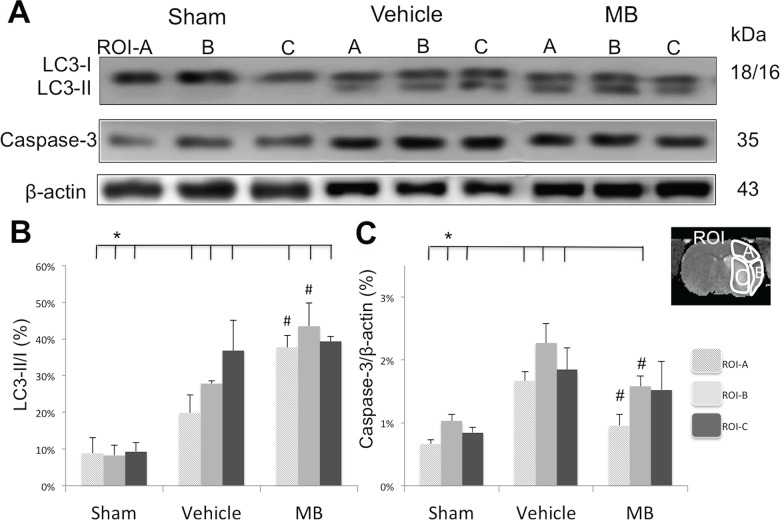
Fig 3. MB’s affects on autophagic and apoptotic markers 24hrs after stroke.
Western blot analysis of autophagic marker LC3-II/I ratio, and apoptotic marker Caspase-3 in sham, vehicle and MB groups. The ratio of expression levels of LC3-II/I (B) were significantly increased in ROI-A and ROI-B of MB treated group compared to that of vehicle group (# p<0.05). Caspase-3 expression level (C) was significantly increased in ROI-A and ROI-B of MB treated group compared to that of vehicle group (# p<0.05). *p<0.05 indicates statistical difference from sham. Values are mean±SEM, n = 5 in each group.

