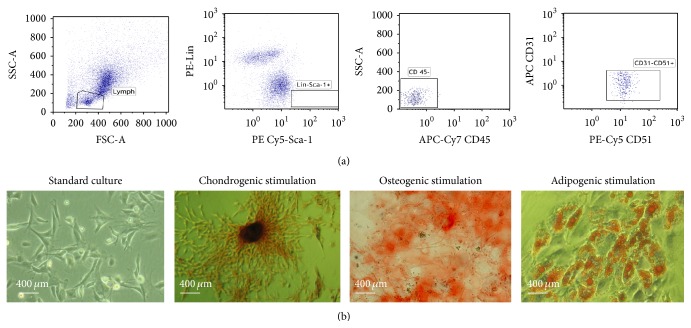
Figure 1.
Analysis of MSC (a) phenotypes using flow cytometry. The FACS profile of separated Sca-1 positive and Lin-negative cells demonstrating CD31negative, CD45negative, and CD51positive MSCs (a). (b) Morphology of MSCs cultured in DMEM medium supplemented with 10% of FBS (standard culture) and the results of its chondrogenic, osteogenic, and adipogenic stimulation. For visualization of glycosaminoglycans and calcium deposits specific Safranin O and Alizarin Red staining were used, respectively, while lipid droplets were stained using Oil Red O.

