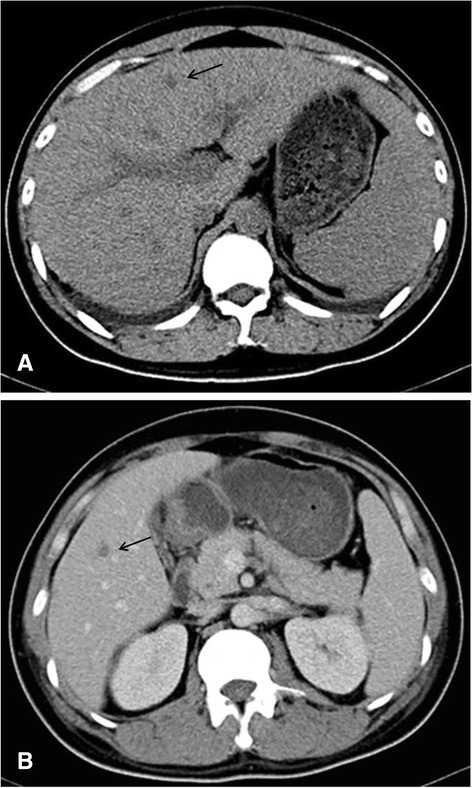
Fig. 6.

Pre-contrast CT images showing multiple low-density hepatic masses with hepatosplenomegaly and bilateral pleural effusion (a). Post-contrast CT images showing contrast enhancement in the portal venous phase (b)

Pre-contrast CT images showing multiple low-density hepatic masses with hepatosplenomegaly and bilateral pleural effusion (a). Post-contrast CT images showing contrast enhancement in the portal venous phase (b)