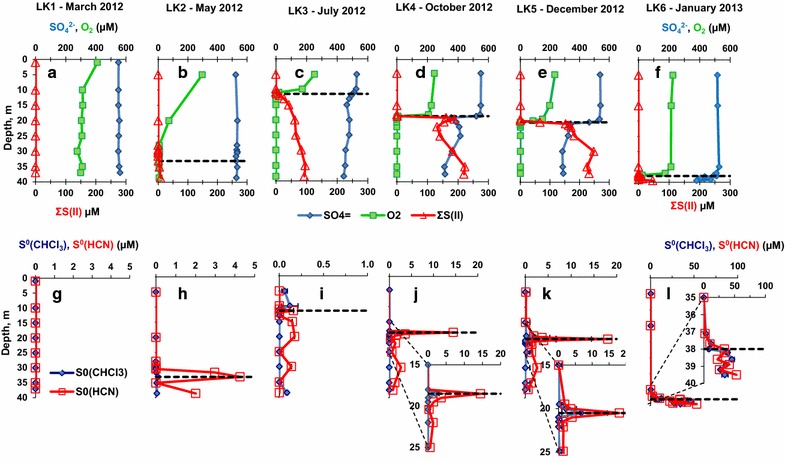
Figure 4.

Seasonal variations in the depth profiles of dissolved oxygen, sulfate, total S(II), chloroform extractable zero-valent sulfur, and hydrogen cyanide-reactive zero-valent sulfur in Lake Kinneret. Black dashed lines denote the chemocline depth. In panels a–f error bars are smaller than the symbols. a Dissolved oxygen, sulfate, and total S(II) during the LK1 sampling, b dissolved oxygen, sulfate, and total S(II) during the LK2 sampling, c dissolved oxygen, sulfate, and total S(II) during the LK3 sampling, d dissolved oxygen, sulfate, and total S(II) during the LK4 sampling, e dissolved oxygen, sulfate, and total S(II) during the LK5 sampling, f dissolved oxygen, sulfate, and total S(II) during the LK6 sampling, g chloroform extractable zero-valent sulfur and hydrogen cyanide-reactive zero-valent sulfur during the LK1 sampling, h chloroform extractable zero-valent sulfur and hydrogen cyanide-reactive zero-valent sulfur during the LK2 sampling, i chloroform extractable zero-valent sulfur and hydrogen cyanide-reactive zero-valent sulfur during the LK3 sampling, j chloroform extractable zero-valent sulfur and hydrogen cyanide-reactive zero-valent sulfur during the LK4 sampling, k chloroform extractable zero-valent sulfur and hydrogen cyanide-reactive zero-valent sulfur during the LK5 sampling, l chloroform extractable zero-valent sulfur and hydrogen cyanide-reactive zero-valent sulfur during the LK6 sampling.
