
Fig. 2.
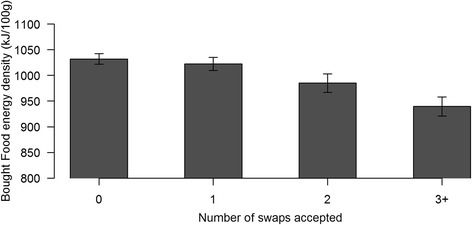
Purchased food energy density as a function of number of swaps accepted for participants offered swaps (all intervention groups combined). (Error bars indicate SEM)
Official websites use .gov
A
.gov website belongs to an official
government organization in the United States.
Secure .gov websites use HTTPS
A lock (
) or https:// means you've safely
connected to the .gov website. Share sensitive
information only on official, secure websites.
Purchased food energy density as a function of number of swaps accepted for participants offered swaps (all intervention groups combined). (Error bars indicate SEM)