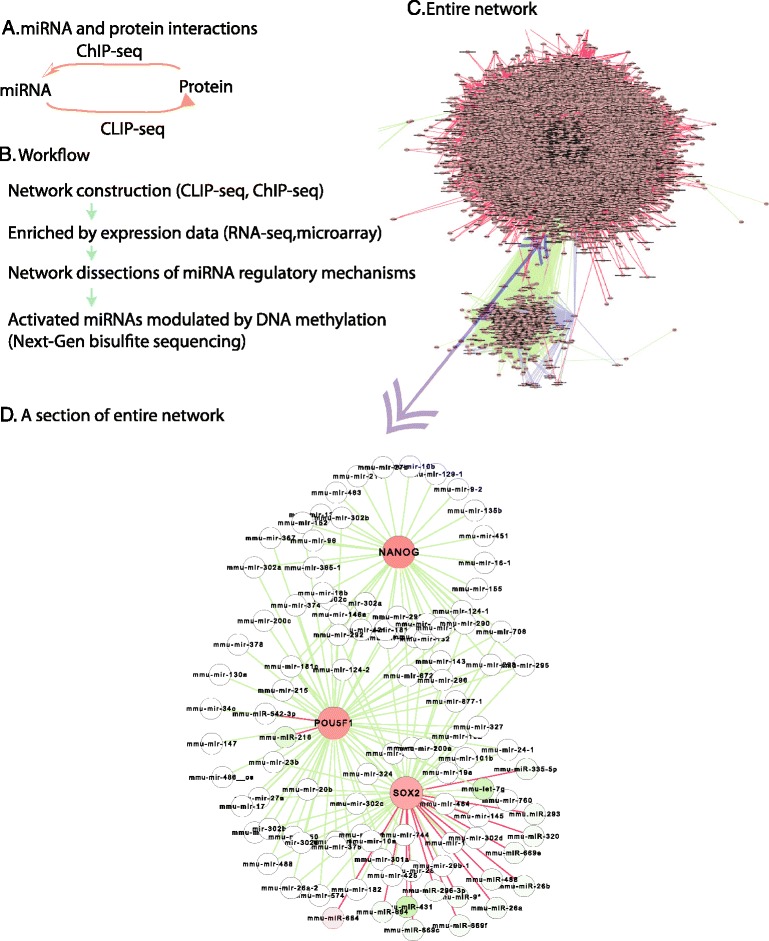
Fig. 1.

Overall view. a, The concept of miRNA and protein interactions. b, Workflow of this study. c, Overall view of the entire network constructed by this study. d, A sample of entire network contents shows direct interactions between miRNAs and pluripotent core factors (Nanog, Pou1f5, and Sox2). Nodes denote miRNAs or proteins as labeled; red node represents the gene up-regulation in pluripotent stem cells, green node as down-regulation, and white node as insignificant expression. Edges (lines) represent interactions; red edge denotes miRNAs targeting proteins (from miRNAs to proteins) and green edge represents the binding of proteins with the regulatory elements of miRNAs (from proteins to miRNAs). This labeling strategy applies to all Fig.s in this study
