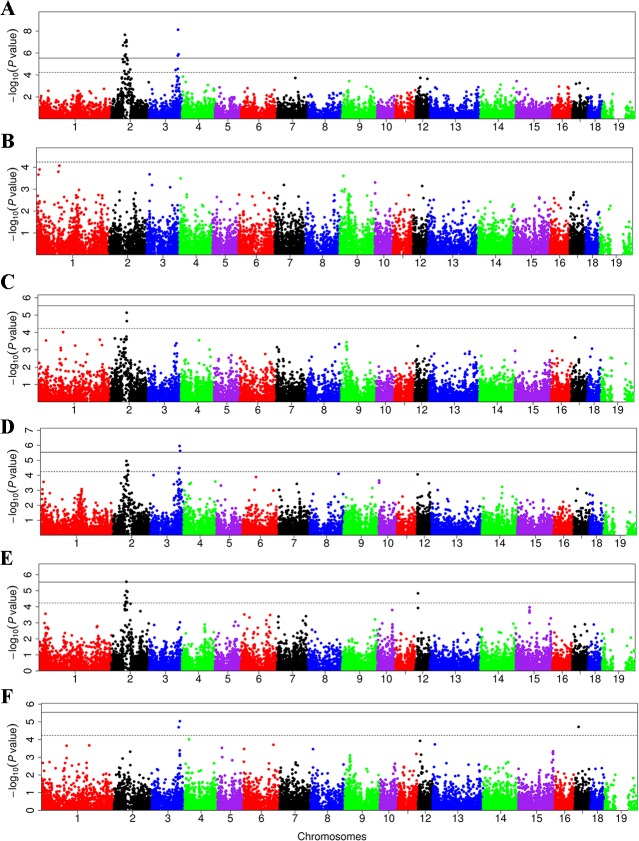
Fig 2. Manhattan plots of meta-analysis of GWAS for blood lipid traits in the five experimental populations.
The x-axis shows chromosomal positions, and y-axis shows negative log10 P values. The solid and dashed lines indicate the thresholds of genome-wide and suggestive significance, respectively. Panels (A) to (F) represent the meta-analysis results for LDL-C, HDL-C, HDL-C/LDL-C, TC, TG and AI, respectively.

