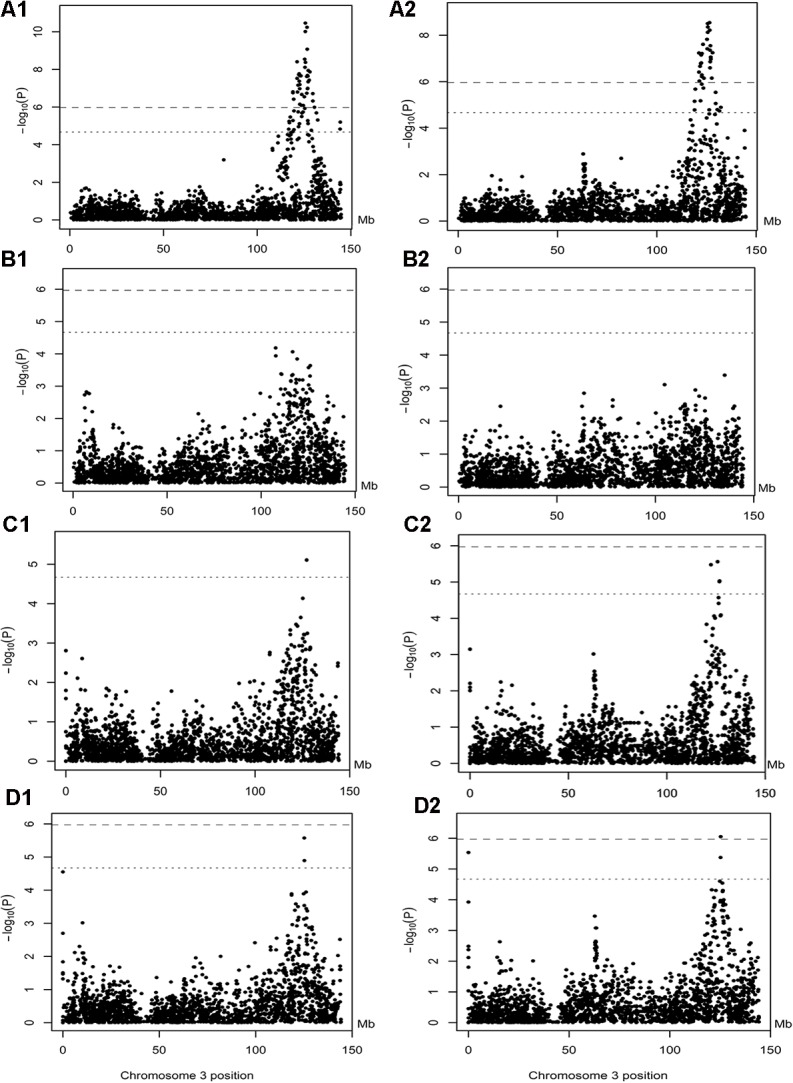
Fig 4. The results of F-drop test in Laiwu pigs.

The x-axis shows SNP positions on SSC3 (Mb); the negative log10 (P values) is presented on the y-axis. The horizontal dotted and dashed lines indicate the thresholds of suggestive and genome-wide significance, respectively. A1 and A2 show the GWAS results for LDL-C and TC in the Laiwu population with all qualified SNPs on SSC3, in which the genotypes of 9 polymorphisms were also included; B1, C1 and D1 show the F-drop test results for LDL-C, in which the genotypes of indel, NW_003613573.1:g.20713A>G and NW_003613573.1:g.48834A>T were included as a fixed effect in the model, respectively; B2, C2 and D2 present the F-drop test results for TC.
