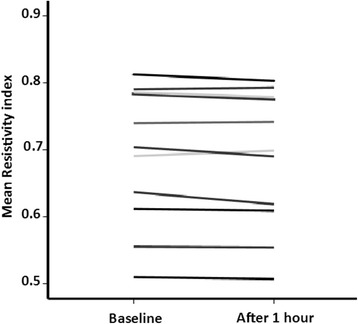
Fig. 3.

Individual changes in RI over time in the non-intervention group (Control group B). Each line corresponds to the change in RI in one stable ICU patient. Measurements were performed at baseline and 1 hour later in stable hemodynamic conditions with no intervention
