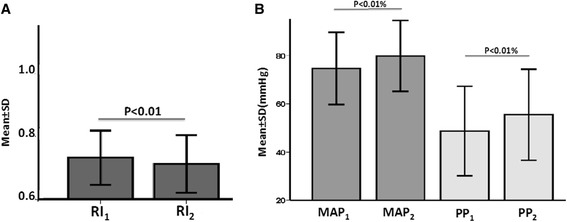
Fig. 4.

Changes in hemodynamic variables before and after fluid challenge. a Changes in resistivity index (RI). b Changes in mean arterial pressure (MAP) and in pulse pressure (PP). The y-axes show the mean values ± standard deviation. MAP1, PP1, RI1 are values before fluid challenge and MAP2, PP2, RI2 are values after fluid challenge
