
Fig. 4.
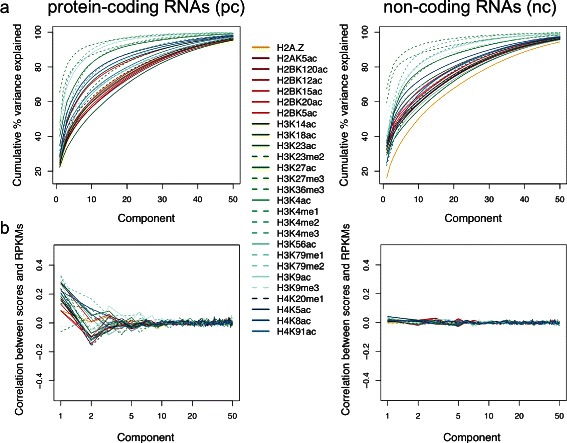
Correlation between chromatin marks and gene expression values. (a) Cumulative proportion of variance explained by 50 eigenfunctions for protein-coding and non-coding RNAs in 26 histone modification and one histone variant ChIP-seq data sets. Values correspond to FPCA analysis in regions ± 5 kb around the TSSs for H1 hESC. (b) Pearson correlation between RPKM gene expression values and functional principal scores for each chromatin mark. X-axis is represented in log-scale