
Fig. 1.
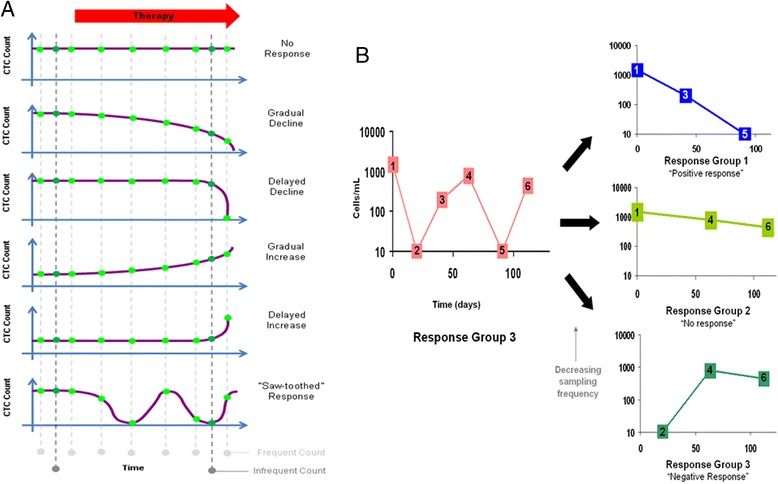
CTC response patterns in cancer patients undergoing therapy. a Hypothetical CTC count patterns corresponding to patient response to therapy. The light green circles represent frequent sampling times, and the dark green circles represent infrequent sampling times. b CTC count pattern of a breast cancer patient from response group 3 of Pachmann et al. [18]. CTC count patterns are simulated when the frequency of sampling is halved from six to three sampling points. The sampling points chosen for each simulation are numbered