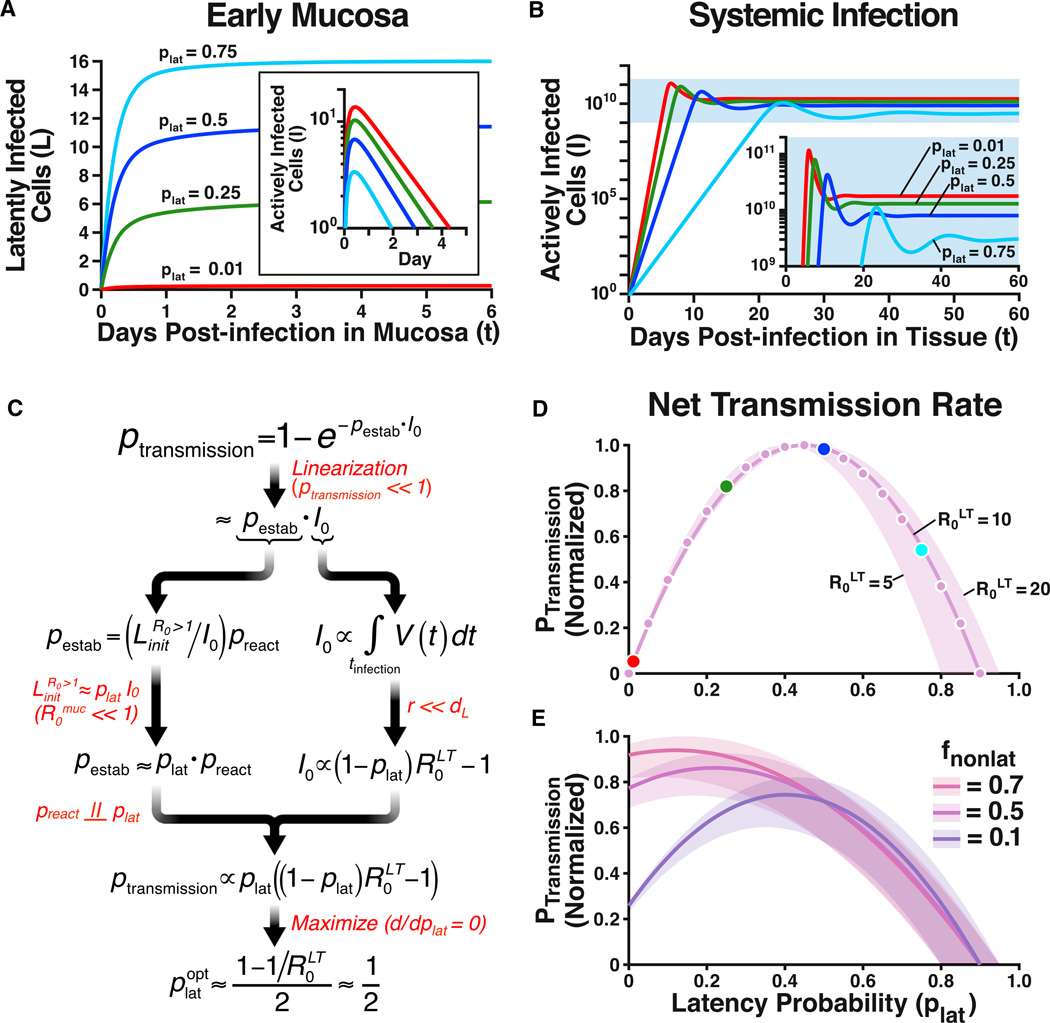
Figure 2. An Evolutionary Optimum for Latency.
(A) Numerical solutions to Equation [6] showing the dynamics of latently infected cells in early mucosal infection (R0muc = 0.25). As plat increases, the number of surviving latently infected cells increases. (Inset) The dynamics of actively infected cells in early mucosal infection showing that as plat increases, actively infected cells reach extinction more rapidly.
(B) In systemic infection, (R0LT = 10), increases in plat decrease the virus load (and, therefore, the viral dose transmitted to the next host). Dynamics in (A and B) are calculated numerically from Equation [6], using the parameters in Table S1 (r = 0).
(C) Schematic flowchart of the derivation of the (optimal) latency probability that maximizes ptransmission. Red text indicates key assumptions made at each step of the derivation. For example, R0muc < < 1 implies that the vast majority of latently infected cells during initial infection are produced in the first generation, leading to the approximation . The results of the analytic derivation quantify the tradeoff of latency: increasing plat linearly increases pestab but decreases I0 by the factor (1-plat). Since this tradeoff is almost equally balanced, the optimal latency probability, , approximately equals 0.5.
(D) Normalized probability of host-to-host transmission (ptransmission) as a function of plat. Results shown are obtained either analytically, from Equation [5] (magenta line), or numerically using the plateau levels of actively infected cells (I) and latently infected cells (L) simulated in A and B (magenta dots). As in C, the probability of transmission is maximized when plat ~0.5.
(E) Normalized probability of host-to-host transmission when systemic infections emerge from non-latent routes (e.g., dendritic cells) with probability fnonlatent > 0 (Equations [S12 and S13]). The maximum probability of transmission occurs at slightly lower plat values, but is still large.
See also Figure S2.

