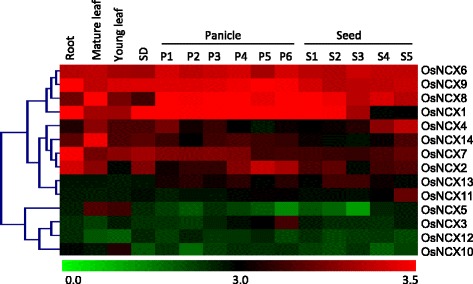
Fig. 7.

Expression analysis of rice NCX genes at different developmental stages using microarray data. Heat map and hierarchical clustering displays differential expression profile of rice NCX genes across various developmental stages. Color bar at the bottom represents log2 expression values, thereby green color representing lowest expression levels, black medium expression and red signifies highest expression level. Developmental stages used for expression analysis are mentioned on the top of each column. Various stages used for the expression profiling (from left to right in the heat map) are: Roots of 7- day old seedling, Mature leaf (collected before pollination), young leaf, SD-7-day old seedling, P1 (0–3 cm panicle), P2 (3–5 cm panicle), P3 (5–10 cm panicle), P4 (10–15 cm panicle), P5 (15–22 cm panicle), P6 (22–30 cm panicle), S1 (0–2 DAP), S2 (3–4 DAP), S3 (5–10 DAP), S4 (11–20 DAP) and S5 (21–29 DAP)
