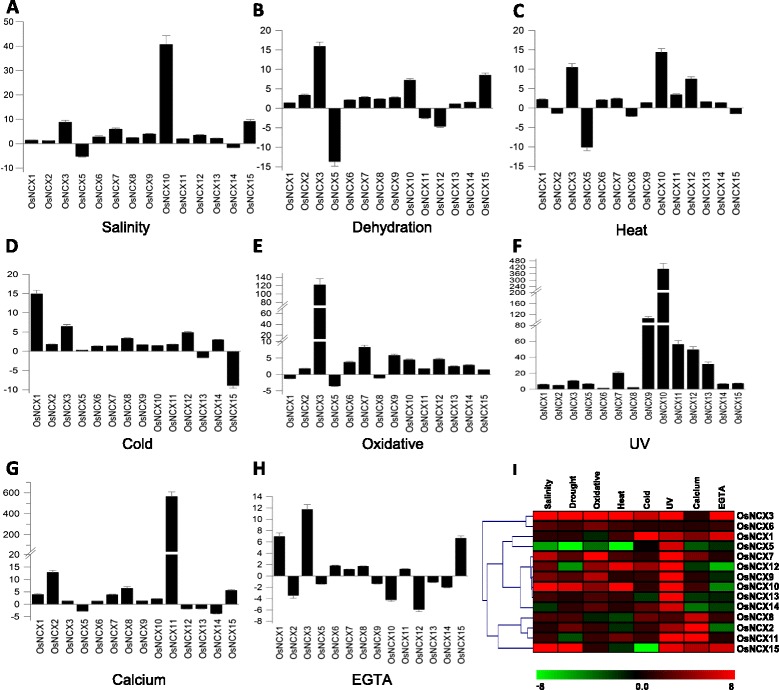
Fig. 8.

Expression profiling of rice NCX genes under different abiotic stresses using qRT-PCR. Bar graphs show fold change in expression of rice NCX genes under various abiotic stresses, viz. a salinity, b dehydration, c heat, d cold, e oxidative (MV), f UV-B, g calcium (calcium chloride) and h calcium chelator EGTA i Heat map generated from the above qRT-PCR data representing the expression profile of rice NCX genes under different abiotic stresses and calcium and EGTA treatment. Color bars at the base represent fold change in expression; green, black and red colors represent downregulated, unaltered and upregulated expression of genes relative to the untreated control, respectively
