Figure 1.
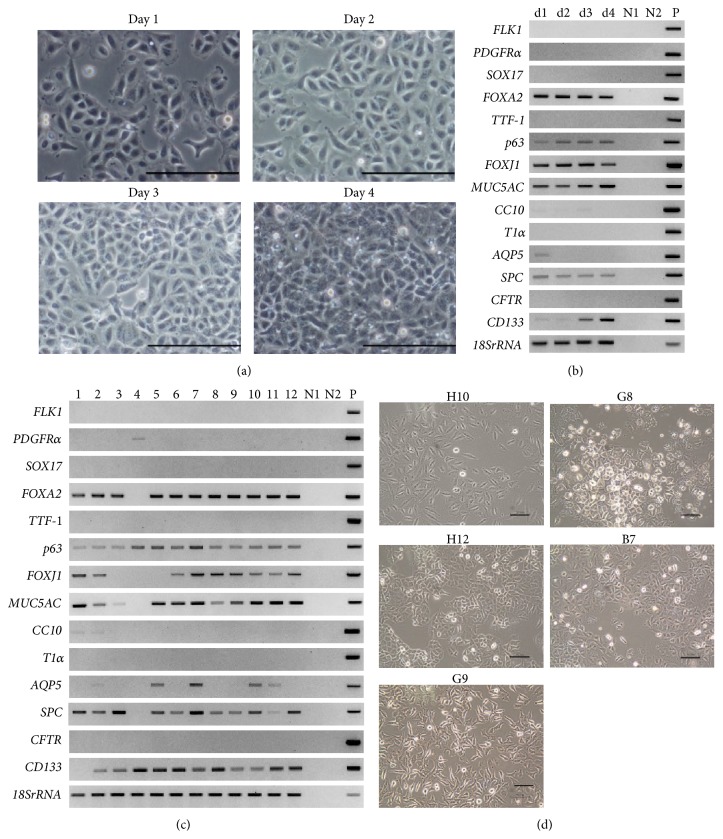
Characterization of A549 cells. (a) Representative morphology of A549 parental cells during growing phase. Cells were monitored for 4 days after passage. Scale bars: 100 µm. (b) Gene expression of A549 parental cells shown in (a). 18SrRNA was used as the internal control. d1 to d4: day 1–day 4 shown in (a), N1: negative control of PCR products without RT reaction, N2: negative control with distilled water, and P: positive control with sequenced PCR products in plasmid. (c) Gene expression of A549 clones. The number indicated the group of clones as shown in Table 3. N1, N2, and P are the same symbols as in (b). (d) Representative morphology of A549 clones at 70% confluence. A549 clones were classified into five groups as shown in Table 4 and selected the representative clones. Scale bars: 100 µm.

