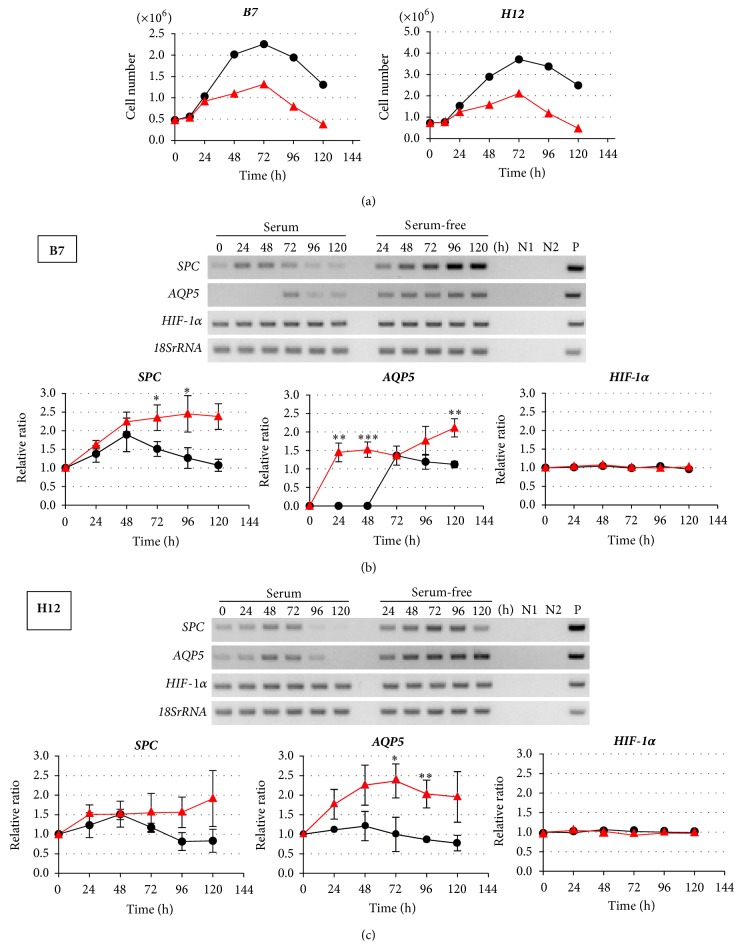
Figure 2.
Effects of serum depletion on cell characteristics of A549 clones. (a) Growth curve of B7 (left) and H12 (right). Black: cultured with serum, red: cultured without serum. (b) and (c) Expression and quantitative analyses of SPC, AQP5, and HIF-1α mRNA in B7 cells (b) and in H12 cells (c). (Upper panel) representative RT-PCR results. N1: negative control without RT reaction, N2: negative control with distilled water, and P: positive control with sequenced PCR products in plasmid. (Lower three panels) quantitative analysis of gene expression. Black: cultured with serum, red: cultured without serum. Experiments were independently performed in triplicate. ∗ p < 0.05; ∗∗ p < 0.01; ∗∗∗ p < 0.001.

