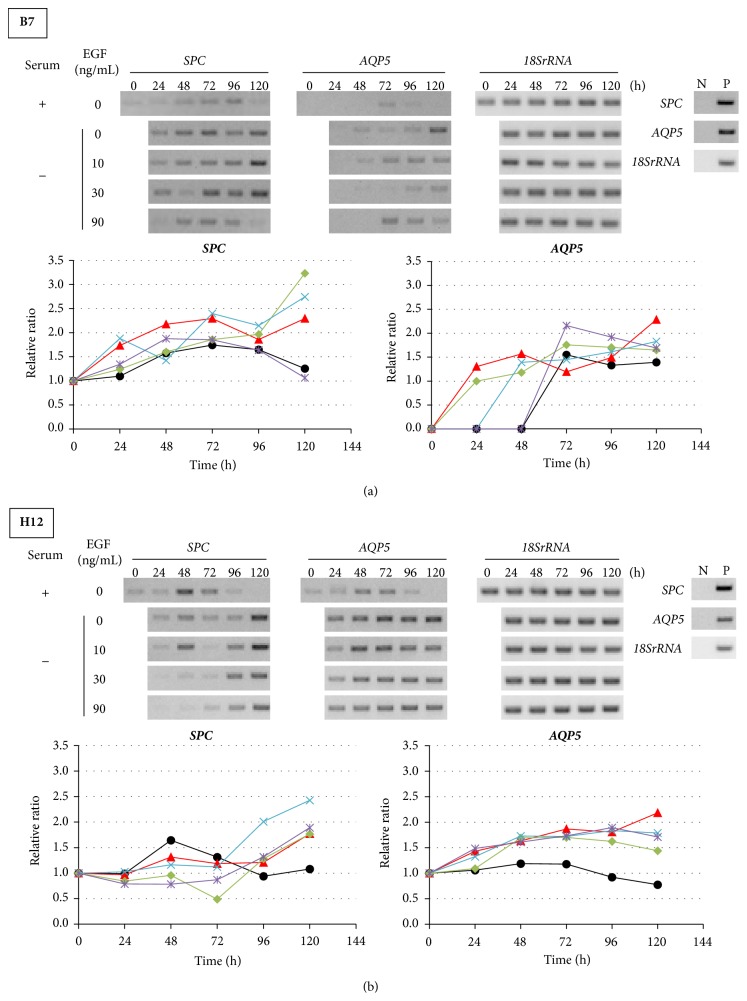
Figure 3.
Effects of EGF treatment on gene expression in B7 and H12 clones. (a) and (b) Expression and quantitative analyses of SPC and AQP5 mRNA in (a) B7 and in (b) H12. (Upper panel) representative RT-PCR results. Serum +: cultured with serum, −: cultured without serum, N: negative control without RT reaction, and P: positive control. (Lower panel) quantitative analyses of gene expression. Black: serum, red: serum-free, green: serum-free + EGF 10 ng/mL, light blue: serum free + EGF 30 ng/mL, and purple: serum-free + EGF 90 ng/mL. All data were independently obtained twice.

