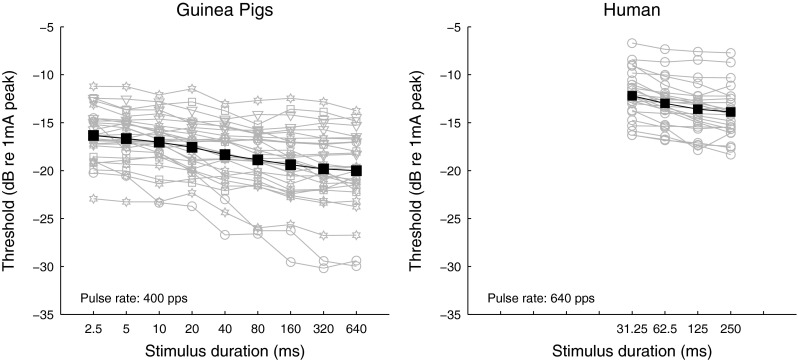
FIG. 3.

Temporal integration (TI) functions measured from guinea pigs (left) and humans (right). Left panel: thresholds are shown for individual guinea pigs in different grey open symbols (see legend in Figure 2) and for group mean in black filled squares. Right panel: thresholds are shown for two individual stimulation sites measured in 12 ears in gray open circles and for group mean in black filled squares.
