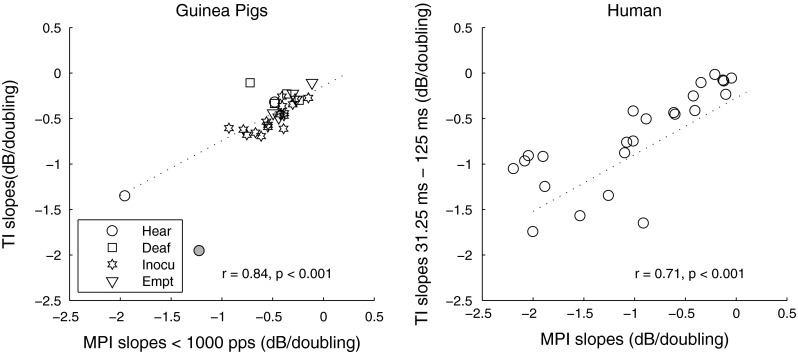
FIG. 4.

Correlation between slopes of the MPI functions and TI functions in guinea pigs (left) and humans (right). Different symbols represent different guinea pig groups (please see “Methods” for details of the groups). The one guinea pig data point that showed statistically significant Cook’s distance is shown in gray and was removed from the statistical analysis for this comparison. The regression lines show linear fit to the data. Correlation coefficients and p values are shown in each panel.
