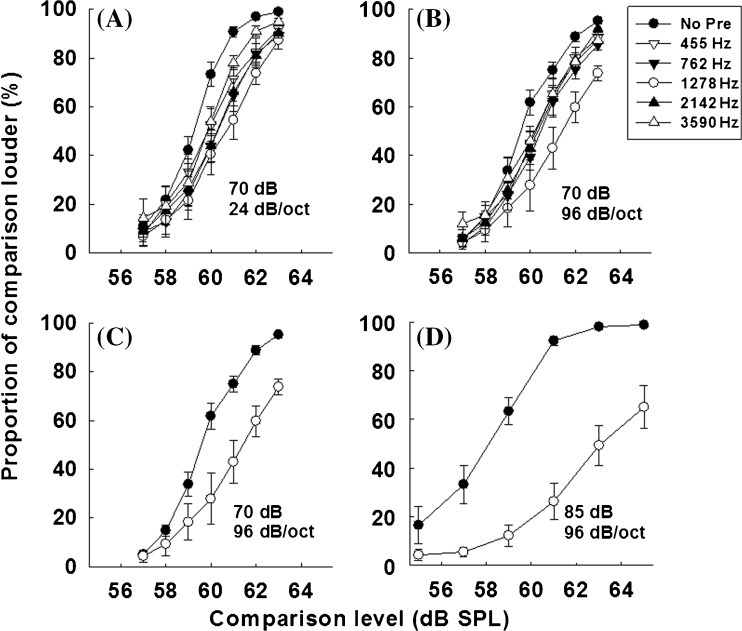
Fig. 2.
Results from normal-hearing listeners. The proportion of trials (%) in which the comparison was judged louder than the target is plotted as a function of the comparison level (dB SPL). The target level was always 60 dB SPL. Panels (A) and (B) show results using a precursor level of 70 dB SPL with filter slopes of 24 and 96 dB/octave, respectively. Panel (C) replots the on-frequency and no precursor conditions from panel (B) for ease of comparison with Panel (D), which shows data using a precursor level of 85 dB SPL and filter slopes of 96 dB/octave. Error bars represent 1 s.e. of the mean.

