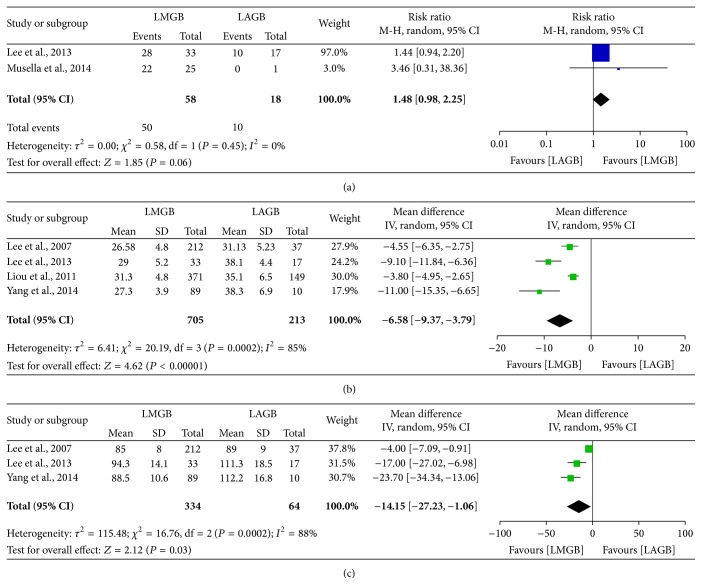
Figure 2.
Meta-analysis comparing LMGB with LAGB. (a) Remission rate of T2DM. (b) Postoperative BMI. (c) Postoperative waist circumference. The estimates of the weighted risk ratio/mean difference in each study corresponded to the middle of each square and the horizontal line gave the 95% CI. The summary risk ratio/mean difference was represented by the middle of the solid diamond.

