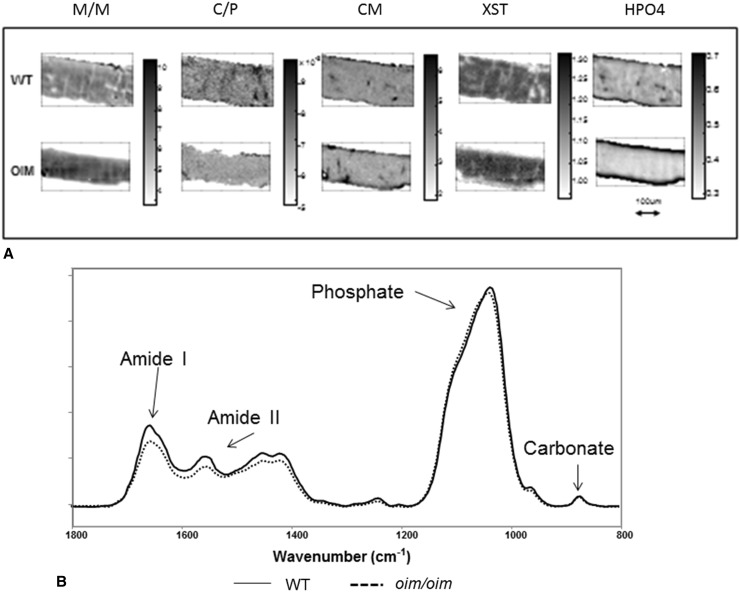
Fig. 3A–B.
(A) Typical FTIR images of WT and oim/oim cortical bone showing all parameters measured. All figures are to the same scale indicated by the arrow. Note the thinner cortex in the oim/oim. Each set of images shows the gray-scale scale bar for that parameter. Parameters are: mineral-to-matrix ratio (M/M), carbonate-to-mineral ratio (C/P), crystal size and perfection (XST), collagen maturity (CM), and acid phosphate substitution (HPO4). (B) Typical spectra were taken from the center of the cortex in WT and oim/oim bone normalized to the phosphate band intensity. Note the slight shift in the phosphate band shape and the major difference in amide I intensity, indicative of the decreased collagen content.

