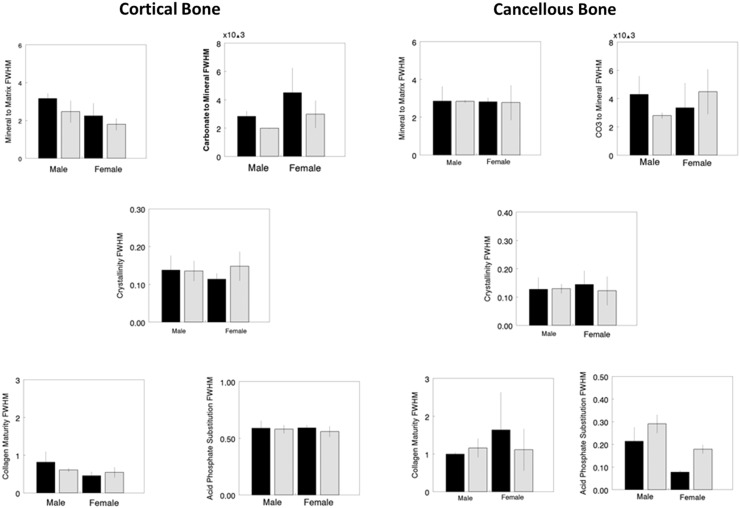
Fig. 4.
FTIR imaging heterogeneity (full width half maximum) data for cortical (left) and cancellous (right) bone areas shows differences between WT (solid bars) and oim/oim (hatched) of the same sex. Parameters shown are mineral-to-matrix ratio (M/M), carbonate-to-mineral ratio (C/P) × 103, crystal size and perfection (XST), collagen maturity (CM), and acid phosphate substitution (HPO4). *Statistical significance, based on Mann-Whitney U-test, indicates WT differs from oim/oim of the same sex with p < 0.05.

