Figure 5.

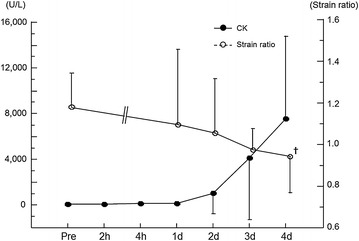
Time course of changes in serum CK activity and strain ratio of the MG before and after exercise. Values are represented as mean ± SD. ✝P < 0.01: significantly lower strain ratio compared with pre-exercise value in the MG.

Time course of changes in serum CK activity and strain ratio of the MG before and after exercise. Values are represented as mean ± SD. ✝P < 0.01: significantly lower strain ratio compared with pre-exercise value in the MG.