Figure 3.

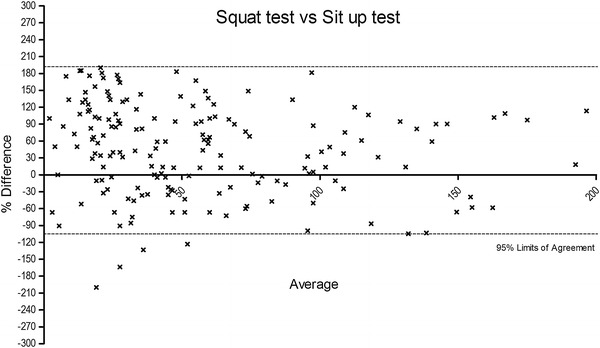
The figure shows the % of difference vs. average of squat test vs. sit up test. A number of seven data points are outside the axis limits.

The figure shows the % of difference vs. average of squat test vs. sit up test. A number of seven data points are outside the axis limits.