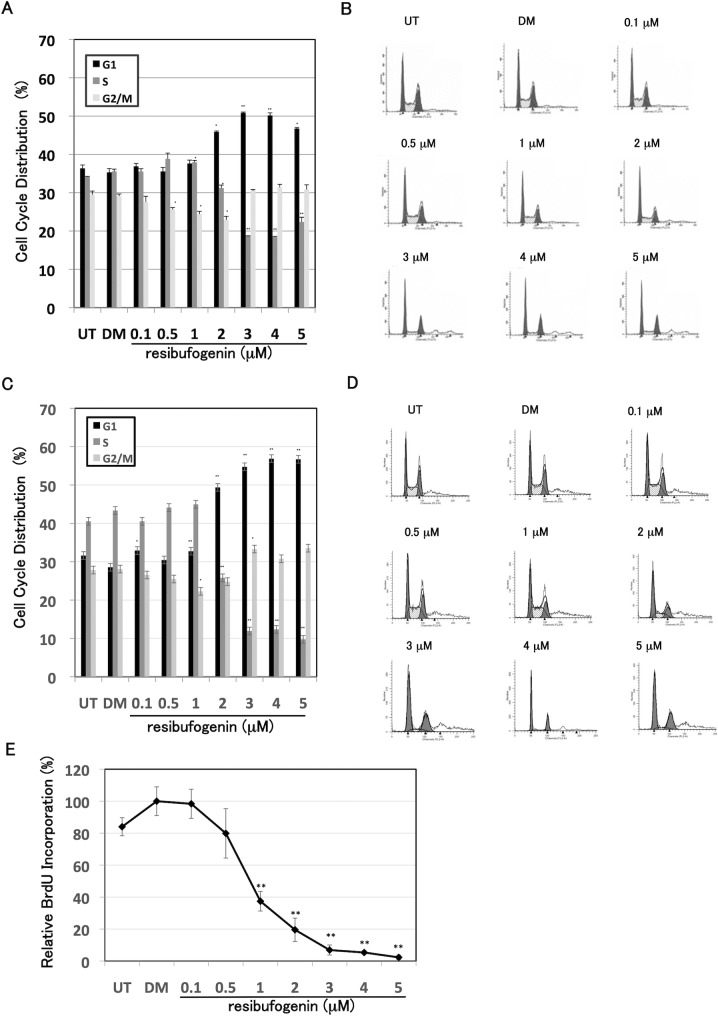
Fig 3. Resibufogenin induces G1-phase arrest in HT-29 cells.
(A) Cell cycle analysis of HT-29 cells treated with resibufogenin. Cells were treated with resibufogenin at the indicated concentrations for 24 h. The DNA content of propidium iodide-stained nuclei was analysed by flow cytometry. The percentages in G1 (black), S (dark gray) and G2/M (light gray) phases of the cell cycle were analysed using Modfit LT software. UT, untreated; DM, treated with DMSO. Points, means (n = 3); bars, SD. *P < 0.05, **P < 0.01, compared with the DMSO-treated control. (B) Representative histogram of each treatment. (C) Cell cycle analysis of HT-29 cells treated with resibufogenin in synchronized cells by serum starvation. Cells were treated with resibufogenin at the indicated concentrations for 24 h after the 24 h serum starvation without FBS. The cell cycle analysis was similarly performed and shown as described in the figure legend of Fig 3A above. (D) Representative histogram of each treatment. (E) BrdU incorporation analysis of HT-29 cells treated with resibufogenin. Cells were treated with resibufogenin at the indicated concentrations for 24 h. Subsequently, the cells were incubated with BrdU for 2 h. The incorporation of BrdU into DNA was measured using a cell proliferation enzyme-linked immunosorbent BrdU assay kit. The data obtained with DMSO was taken as 100%. UT, untreated; DM, treated with DMSO. Points, means (n = 3); bars, SD. **P < 0.01, compared with the DMSO-treated control.

