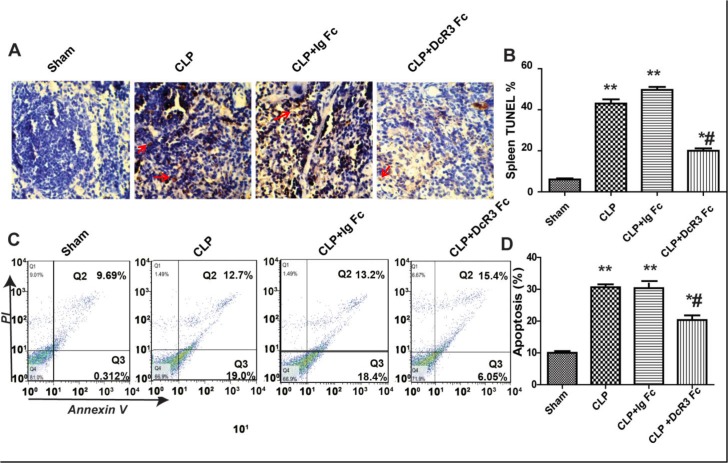
Fig 4. DcR3 Fc administration inhibits apoptosis in the spleen and thymus.
Spleen and thymus were harvested 24 h after CLP. A. Representative sections analyzed using in situ TUNEL assays in spleen. Apoptotic cells are stained with a yellow-brown color in the nuclei (red arrows). B. The percentage of TUNEL-positive cells represents apoptotic cells in spleen. C. Flow cytometry dot plots of annexin V/PI staining. D. The percentage of FACS-positive cells represents apoptotic cells in thymus. Apoptosis was calculated as the percentage of annexin V-positive cells that were the sum of the percentage of cells included in the lower and upper right quadrants. Bars represent the mean ±SD (n = 6 each group). **p <0.01, *p <0.05 vs. sham; # p <0.05 vs. CLP.

