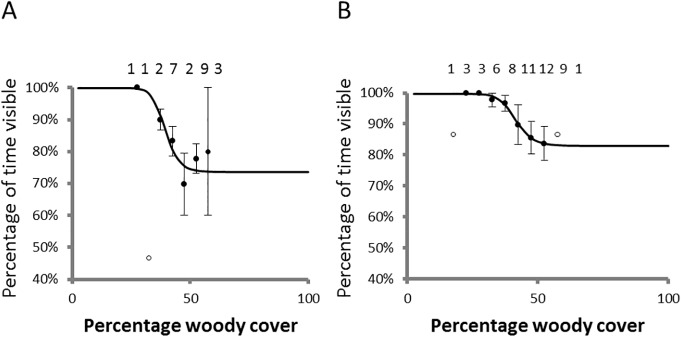
Fig 3. Availability bias for rhinos in Kruger Natonal Park.

Availability biases for black (A) and white rhinos (B) are expressed as the percentage time visible against woody cover of a locality. Open symbols represent outliers typically when only one sample was available. Lines represent fitted inverse sigmoid curves.
